How to Calculate Carbon Fiber Production Line Cost?
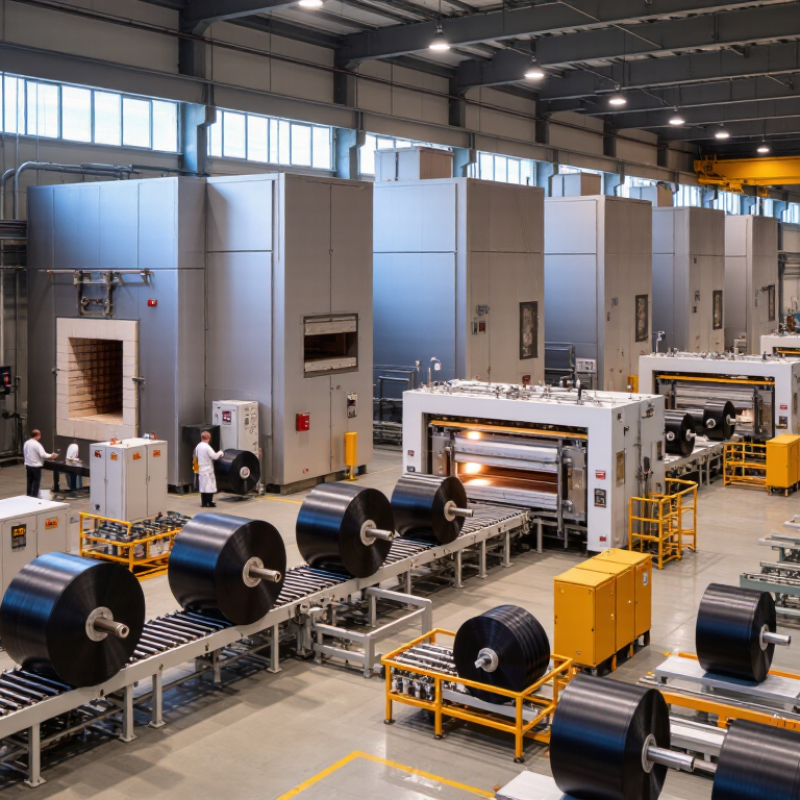
Calculating Carbon fiber production line cost requires more than adding equipment prices. The estimate must connect capacity, precursor choice, energy demand, labor, utilities, and quality control. A line producing standard-tow fiber differs greatly from an aerospace-grade line. Its ovens, oxidation furnaces, carbonization furnaces, and surface-treatment systems require different specifications.
Market demand adds another layer. The International Energy Agency’s Global EV Outlook 2024 reported nearly 14 million electric car sales in 2023. This growth supports wider interest in lightweight carbon fiber components. The 2023 JEC Observer also identified automotive, wind energy, and aerospace as important composites markets. These reports show opportunity, but they do not provide a universal factory price. Regional labor rates, electricity tariffs, land costs, and environmental controls change the investment significantly.
Real projects often expose hidden expenses. Gas purification, exhaust treatment, cooling water, testing instruments, spare parts, and commissioning can alter the budget. ORNL’s Carbon Fiber Technology Facility has repeatedly emphasized process efficiency and lower-cost precursor development. These factors directly influence production economics. Early estimates are often wrong. A practical calculation should therefore separate capital expenditure from operating expenditure. It should also test conservative, expected, and high-cost scenarios. This guide explains how to evaluate Carbon fiber production line cost using measurable inputs, supplier quotations, and production assumptions. Readers should verify every figure against current regional prices and the intended product grade. A cheaper furnace may increase energy use or reduce fiber quality. That trade-off deserves attention.
Define Product Grade and Capacity: 12K–50K Tow and 1,000–5,000 t/y Benchmarks
How to Calculate Carbon Fiber Production Line Cost?
Define Product Grade and Capacity: 12K–50K Tow and 1,000–5,000 t/y Benchmarks
Start with product definition, not equipment quotations. A 12K tow usually serves higher-value, tighter-specification applications. A 50K tow supports larger-volume industrial composites. The fiber grade affects precursor quality, oxidation control, carbonization temperature, testing, and packaging. It also changes yield loss. Industry market reports published in 2024 estimate global carbon fiber demand at roughly 120,000–150,000 tonnes annually. That range shows why capacity assumptions matter.
For an initial model, compare 1,000, 3,000, and 5,000 t/y output. Use this calculation: annual cost equals annualized installed capital, labor, energy, precursor, maintenance, waste, and compliance costs. U.S. Department of Energy and Oak Ridge National Laboratory studies identify precursor conversion, energy use, and line utilization as major cost drivers. A 5,000 t/y line can reduce unit cost through scale, but only if demand keeps the line loaded. A half-empty line is expensive. Often overlooked.
Tips: Separate nameplate capacity from saleable output. Apply a realistic yield factor, such as 85–95%, then test lower cases. Request quotations for 12K, 24K, and 50K products separately. Their ovens, winding systems, testing needs, and changeover losses may differ. Recheck every assumption against local electricity, labor, precursor, and environmental-control costs. A clean spreadsheet can still produce a false sense of precision.
Separate CAPEX for PAN, Oxidation, Carbonization, Surface Treatment, and Winding
How to Calculate Carbon Fiber Production Line Cost?
Calculating carbon fiber production line cost starts with a stage-by-stage CAPEX model. Do not place every machine under one “carbonization” number. Separate equipment, installation, utilities, engineering, commissioning, and contingency for each section. Define annual output, tow size, line speed, and operating hours before requesting quotations. Small assumptions matter.
PAN CAPEX may include polymer preparation, spinning, washing, drying, and precursor packaging. Oxidation requires multiple heated zones, tension control, exhaust handling, and precise residence-time control. Carbonization usually carries the largest equipment burden because furnaces, inert-gas systems, cooling, and heat recovery are substantial. Record furnace length, temperature range, power demand, and gas consumption separately. Otherwise, utilities can hide a serious cost gap. Installation is often underestimated.
Surface treatment CAPEX covers electrolytic treatment, rinsing, drying, and wastewater management. Winding needs tension control, traversing, spool handling, inspection, and packing equipment. Add buildings, fire protection, laboratories, cranes, piping, and control systems outside machine quotations. In project reviews, imported equipment prices were clear, but local civil work was less predictable. That uncertainty deserves a stated allowance, not a vague percentage. Check whether quotes include spare parts, training, taxes, and performance testing. Some estimates still miss ramp-up downtime. Recalculate CAPEX after pilot trials.
How to Calculate Carbon Fiber Production Line Cost?
Indicative capital expenditure allocation for a carbon fiber production line, separated into PAN precursor, oxidation, carbonization, surface treatment, and winding sections.
The example assumes a medium-scale line producing approximately 3,000 metric tons of carbon fiber per year. Estimated equipment CAPEX is shown in 2026 USD millions and excludes land, financing, taxes, contingencies, and working capital. Actual costs vary with production capacity, tow size, automation, energy systems, building requirements, and local installation rates.
Estimate Furnace Energy Demand Using the 183–286 MJ/kg Industry Benchmark
How to Calculate Carbon Fiber Production Line Cost?
Furnace energy can dominate carbon fiber production costs. Industry assessments commonly report 183–286 MJ of process energy per kilogram of carbon fiber. This range appears in carbon fiber life-cycle studies, including analyses from the U.S. Department of Energy and the National Renewable Energy Laboratory. It is a planning benchmark, not a guaranteed factory result.
For a line producing 100 kilograms per hour, the furnace may require 18.3–28.6 GJ per hour. That equals approximately 5.1–7.9 MW of continuous thermal demand. A 1,000-ton annual output could therefore represent 183–286 TJ of process energy, before distribution losses and auxiliary equipment. The calculation is simple: output in kilograms multiplied by the selected MJ/kg value. Electricity prices, fuel choice, furnace efficiency, and operating hours then convert energy demand into cost.
Real projects need a wider margin. Precursor quality, oxidation time, carbonization temperature, and production interruptions can shift consumption significantly. A furnace running below capacity may waste more energy per kilogram. This point is often underestimated. The International Energy Agency’s industrial efficiency reports also emphasize utilization rates and heat recovery as major cost drivers. I would model three cases: 183 MJ/kg for an optimized line, 235 MJ/kg for a practical estimate, and 286 MJ/kg for early-stage planning. The middle case is useful, but imperfect. Pilot data should replace it before final equipment purchasing.
Calculate OPEX with PAN Precursor at 50–55% of Fiber Production Cost
How to Calculate Carbon Fiber Production Line Cost?
PAN precursor often dominates operating expenditure in carbon fiber manufacturing. Industry cost benchmarks place PAN at roughly 50–55% of total fiber production cost. This range aligns with carbon-fiber cost-model studies published by the U.S. Department of Energy. It also reflects precursor conversion losses, stabilization energy, and carbonization requirements.
Use a simple production model. If PAN costs 12 dollars per kilogram and represents 52% of production cost, the implied fiber production cost is about 23.08 dollars per kilogram. The remaining 11.08 dollars covers electricity, natural gas, labor, maintenance, nitrogen, waste, quality control, and plant overhead.
The formula is: production cost equals PAN cost divided by the PAN percentage.
Do not treat this estimate as a final quotation. Energy intensity differs between stabilization and carbonization furnaces. The International Energy Agency reports that industrial energy prices and efficiency strongly affect manufacturing economics. A cost model should therefore record actual furnace consumption, yield, and annual operating hours.
For example, a 5% yield loss can raise PAN consumption noticeably. Small errors matter. Depreciation and financing should remain separate from OPEX. In practice, the 50–55% PAN assumption is useful, but it needs plant-specific validation.
Add Utilities, Emission Controls, Labor, Maintenance, Contingency, and Payback Analysis
How to Calculate Carbon Fiber Production Line Cost?
A carbon fiber production line cost starts with equipment, but the supporting systems often change the final figure. Utilities may include electricity, process water, compressed air, nitrogen, cooling, and heating. Estimate peak demand, not only average consumption. A line using electric furnaces can create substantial power costs during stabilization and carbonization. Emission controls also require capture hoods, filtration, monitoring, ductwork, and safe treatment systems. These costs depend on precursor chemistry, exhaust volume, and local environmental requirements.
Labor should cover operators, maintenance technicians, quality staff, engineers, and shift supervision. Include training time and replacement coverage. Maintenance budgets commonly include seals, heating elements, rollers, sensors, filters, and calibration. A realistic annual allowance may be based on equipment value, but supplier data and operating history are more reliable. Contingency is essential. Ten percent may be inadequate for complex installations, especially when civil work or utility upgrades remain uncertain. Early estimates are rarely perfect.
Tips: Build a monthly cash-flow model. Separate fixed and variable costs. Record utility use by process stage. Test three scenarios: conservative, expected, and optimistic. Small errors compound. Payback analysis should compare total installed cost with annual gross margin, not revenue alone. Deduct energy, labor, maintenance, consumables, emissions management, financing, and downtime. Divide the adjusted investment by annual net cash benefit. A five-year payback may look attractive, yet unstable yield can weaken it. Review assumptions after pilot production. That step is often missed.
How to Calculate Carbon Fiber Production Line Cost? - Add Utilities, Emission Controls, Labor, Maintenance, Contingency, and Payback Analysis
1. Project Basis and Operating Assumptions
| Parameter | Assumption | Unit | Costing Relevance |
| Production route | PAN precursor-based continuous carbon fiber line | — | Includes stabilization, carbonization, surface treatment, sizing, and winding |
| Finished carbon fiber capacity | 1,000 | metric tonnes/year | Nominal nameplate capacity |
| Operating schedule | 330 days/year, 24 hours/day | hours/year | Approximately 7,920 scheduled operating hours |
| Expected utilization | 85% | % of nameplate capacity | Expected saleable output of approximately 850 tonnes/year |
| PAN-to-carbon-fiber yield | 50% | mass yield | Approximately 2.0 tonnes of PAN precursor per tonne of carbon fiber |
| Electricity price | $0.10 | USD/kWh | Industrial blended electricity rate |
| Natural gas price | $0.16 | USD/Nm³ | Used mainly for high-temperature furnace heating |
| Currency and estimate basis | 2026 budgetary estimate | USD, excluding land purchase | Actual pricing depends on country, specification, logistics, and local regulations |
2. Estimated Capital Investment
| Cost Category | Scope Included | Estimated Cost (USD) | Share of Pre-Contingency Cost |
| PAN precursor preparation and feed system | Creels, tension control, tow handling, feed frames, and material storage | $780,000 | 6.5% |
| Stabilization and oxidation ovens | Multi-zone ovens, temperature control, exhaust collection, and line integration | $1,650,000 | 13.8% |
| Carbonization furnaces | Low-temperature and high-temperature furnace sections with inert-gas systems | $3,200,000 | 26.8% |
| Surface treatment and sizing equipment | Electrochemical treatment, sizing bath, dryers, pumps, and filtration | $830,000 | 7.0% |
| Winding, slitting, and packaging | Take-up units, winding stations, slitting, weighing, and packaging equipment | $320,000 | 2.7% |
| Material handling and internal logistics | Roll handling, lifting equipment, storage racks, and production-floor transport | $220,000 | 1.8% |
| Process control and quality laboratory | PLC/SCADA controls, sensors, tensile testing, mass measurement, and inspection tools | $280,000 | 2.3% |
| Mechanical and electrical installation | Equipment erection, piping, cabling, commissioning support, and field labor | $1,450,000 | 12.1% |
| Utility infrastructure | Transformers, gas train, cooling water, compressed air, nitrogen distribution, and HVAC | $1,100,000 | 9.2% |
| Emission-control systems | Exhaust hoods, thermal oxidizer, filters, ductwork, monitoring, and stack equipment | $850,000 | 7.1% |
| Building modifications and production area | Fire protection, flooring, ventilation, insulation, drainage, and clean utility rooms | $1,400,000 | 11.7% |
| Engineering, permitting, and start-up | Process engineering, detailed design, permits, operator training, and performance testing | $650,000 | 5.4% |
| Pre-contingency capital cost | $12,730,000 | 100.0% |
| Contingency allowance | 15% allowance for design development, installation changes, inflation, and unforeseen work | $1,909,500 | 15.0% of pre-contingency cost |
| Estimated total installed capital investment | $14,639,500 | — |
3. Annual Operating Cost at 85% Utilization
| Operating Cost Item | Calculation Basis | Annual Quantity or Rate | Annual Cost (USD) |
| PAN precursor | 1,700 tonnes/year × $2.25/kg | 2.0 kg PAN per kg finished fiber | $3,825,000 |
| Electricity | 7.2 GWh/year × $0.10/kWh | 7,200,000 kWh/year | $720,000 |
| Natural gas and furnace fuel | 2,000,000 Nm³/year × $0.16/Nm³ | 2,000,000 Nm³/year | $320,000 |
| Water, cooling, nitrogen, and compressed air | Process water, cooling systems, inert gas, and plant air | Site-specific consumption | $210,000 |
| Emission-control operation | Oxidizer fuel, filter media, reagents, sampling, and compliance monitoring | Annual operating allowance | $180,000 |
| Direct labor | Approximately 35 production, maintenance, laboratory, and shift-support employees | Wages, benefits, and shift premiums | $1,200,000 |
| Maintenance and spare parts | Approximately 4% of pre-contingency installed capital cost | Routine and preventive maintenance | $509,200 |
| Process consumables and quality control | Sizing chemicals, electrodes, filters, test supplies, and packaging materials | Annual operating allowance | $240,000 |
| Waste handling and wastewater treatment | Off-specification fiber, filter waste, chemical residues, and wastewater | Annual operating allowance | $120,000 |
| Insurance, administration, and plant overhead | Property insurance, management, training, security, and general overhead | Annual operating allowance | $250,000 |
| Estimated total annual operating cost | $7,574,200 |
| Estimated operating cost per kilogram of finished fiber | $8.91/kg |
4. Revenue, EBITDA, and Simple Payback Analysis
| Financial Metric | Calculation | Result | Interpretation |
| Annual saleable output | 1,000 tonnes/year × 85% utilization | 850 tonnes/year | Excludes start-up losses and planned downtime beyond the operating assumption |
| Assumed average selling price | Indicative blended price for standard industrial-grade fiber | $16.00/kg | Actual price depends on tow size, strength, modulus, certification, and contract terms |
| Annual revenue | 850,000 kg × $16.00/kg | $13,600,000 | Before taxes, financing costs, depreciation, and working-capital effects |
| Annual operating cost | From operating-cost estimate above | $7,574,200 | Includes utilities, emission controls, labor, maintenance, and overhead |
| Estimated EBITDA | Annual revenue − annual operating cost | $6,025,800 | Indicative operating cash-flow proxy before depreciation, interest, and tax |
| EBITDA margin | $6,025,800 ÷ $13,600,000 | 44.3% | Sensitive to selling price, precursor cost, capacity utilization, and energy prices |
| Simple payback period | $14,639,500 ÷ $6,025,800 | 2.43 years | Undiscounted estimate; excludes taxes, financing, working capital, and ramp-up period |
| Indicative break-even selling price | Annual operating cost ÷ annual saleable output | $8.91/kg | Operating break-even only; does not recover capital investment or financing costs |
| Indicative capital recovery price | Operating cost + capital recovery over five years | $12.36/kg | Approximate price required to recover installed capital over five years before tax and financing |
5. Sensitivity of Simple Payback
| Scenario | Utilization | Average Selling Price | Estimated EBITDA | Simple Payback |
| Downside case | 70% | $13.00/kg | $2,594,000/year | 5.64 years |
| Base case | 85% | $16.00/kg | $6,025,800/year | 2.43 years |
| Upside case | 95% | $18.00/kg | $8,911,800/year | 1.64 years |
Note: These figures are an illustrative budgetary model for a continuous PAN-based carbon fiber line. A bankable feasibility study should replace the assumptions with supplier quotations, local utility tariffs, labor rates, environmental permitting requirements, product specifications, taxes, financing costs, working capital, depreciation, ramp-up losses, and discounted cash-flow analysis.
